
- Documentation
- Getting Started
- JArchitect Analysis
- JArchitect Plugin for Sonar
- Code Rule and Query
- JArchitect Features
- Build Process Integration
- Code Metrics Definitions
- Code Coverage FAQ
- Trend Monitoring
Getting Started with JArchitect
- How do I analyze my Java applications using JArchitect?
- What does the JArchitect report tell me about my code?
- I want to go further to have a better control over my code
- How can I master JArchitect Features?
How do I analyze my Java applications using JArchitect?
- Run Visualjarchitect.exe from windows OS, launchVisualjarchitect.sh from Linux, or JArchitect.app from Mac OS X.
- Select the option: Create New Project
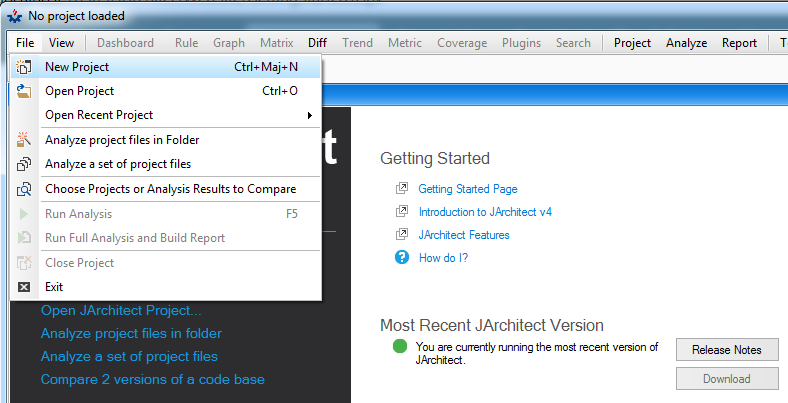
- Populate the data grid with your projects by using the browse button.
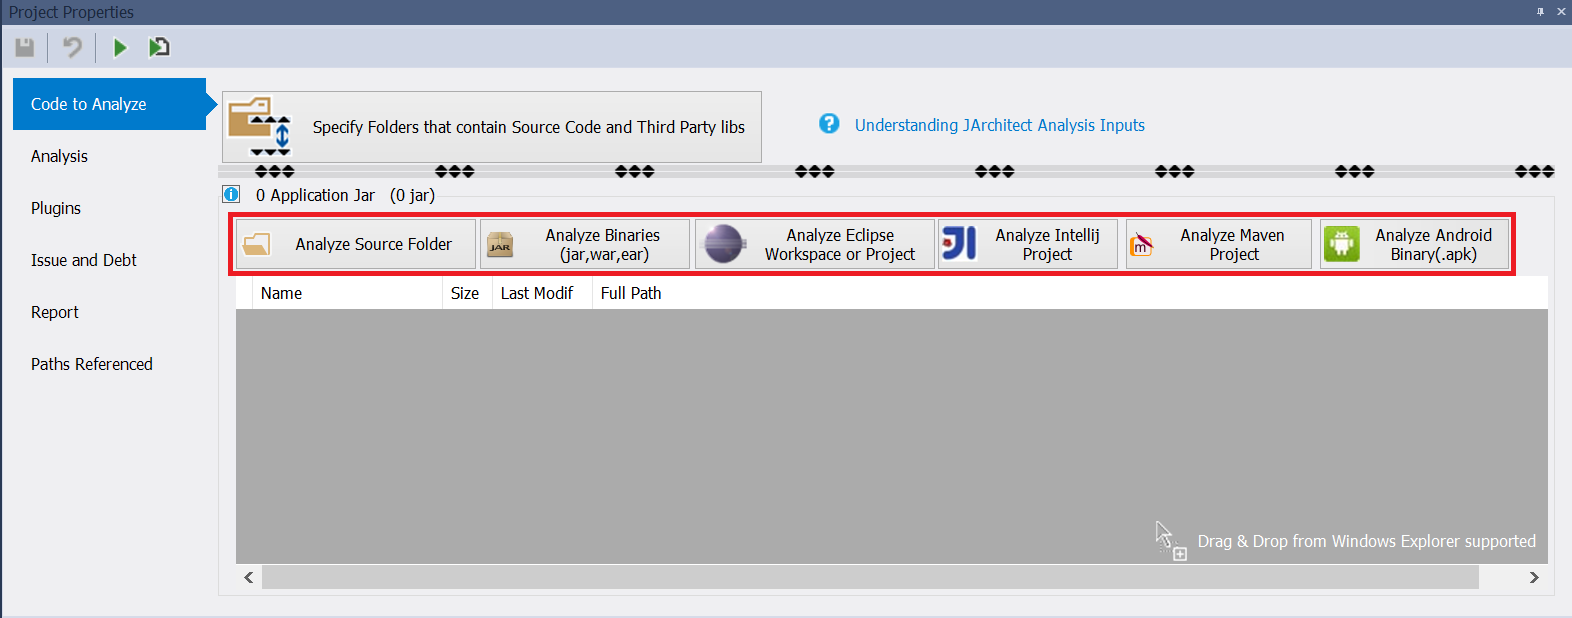
JArchitect analyze the specified applications kind:
- Source code,
- jar and war files,
- Eclipse,
- Maven,
- NetBeans,
- IntelliJ,
- Android Binary (.apk).
-
In the case of jar and war analysis you have to specify directories where libs and code source exist, by clicking on "View Folders that contains source code and third party libs" button.
- Maven: pom.xml,
- Eclipse: .project or workspace directory by using "Add Eclipse Workspace" button,
- NetBeans: project.properties file,
- IntelliJ: .iml;.ipr files and for directory based project you can choose also workspace.xml from .idea directory.
The easy way is to analyze eclipse, Intellij or Netbeans workspaces and projects, and JArchitect detect all data needed for analysis. And here's files to provide for these projects:
-
Click F5 to analyze your projects and source code by jarchitect.Console.exe.
This analysis will take a few seconds to a few minutes depending on the size of the projects.
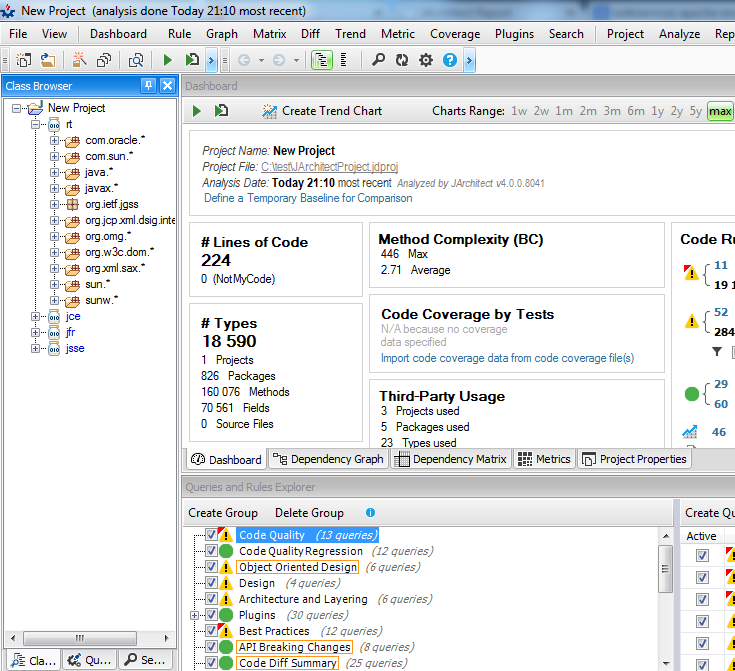
- Once the analysis done, the result is displayed in the Visualjarchitect UI.
What does the jarchitect report tell me about my code?
- Application Metric: This section gives you an idea of the topology of your application.
- Project Metric: This section gives you an idea of the size of each project within your application in terms of code line and others metrics.
- Visualjarchitect View: This section illustrates the size of your projects, packages, types and methods in terms of code line. You can browse this view dynamically by clicking the Launch Visual JArchitect on this Project icon in the JArchitect.Project UI.
- Project Abstracness vs. Instability: This section illustrate the Abstracness/Instability principle explained in the projects metrics section.
- Project Dependencies: This section shows all dependencies between project of your application in a table.
- Project Dependency Diagram: This section shows all dependencies between projects of your application in a diagram
- Project build order: This section gives you one of the possible build order for your projects. If a cycle exists in your projects dependencies graph, this section will report it.
- CQLinq Queries and Constraints: This section reports default CQLinq constraints which have been violated. More about the CQLinq language and CQL constraints here. You can build your own CQL constraints with Visualjarchitect.
- Type Metrics: This section recaps type metrics in a table. A link to the documentation is provided for each metric.
I want to go further to have a better control over my code
- Understand metrics yielded by JArchitect and read recommendations.
- Get a new understanding of your code by playing with the JArchitect panels. Modify the view with the Level and Metric combo boxes.
- Tune your report thanks to the Output panel in the JArchitect.Project UI.
- Learn CQLinq, adapt existing CQLinq code rules and create your own ones.
- Integrate the JArchitect report in your daily build process.
How can I master jarchitect Features?
You can begin with these case studies for some known Java projects.